Features

01 Dashboard

Where the day stands

  • Session count for the day against the stored total
  • Subscribers currently online, refreshed on demand
  • Processor, memory and disk on the same view
  • Newest sessions listed as the routers deliver them
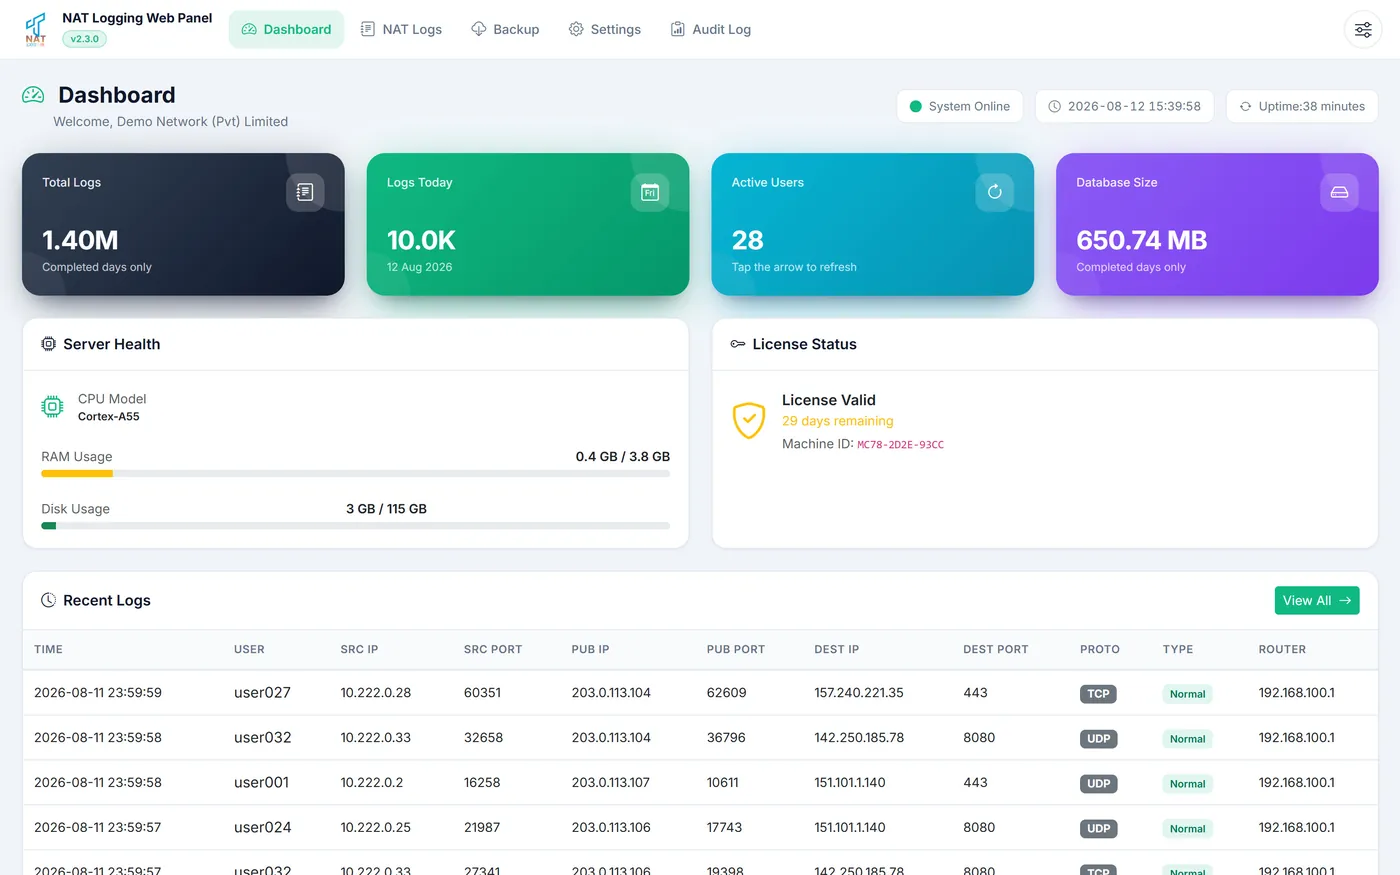
The dashboard, with the day's counts and the newest sessions
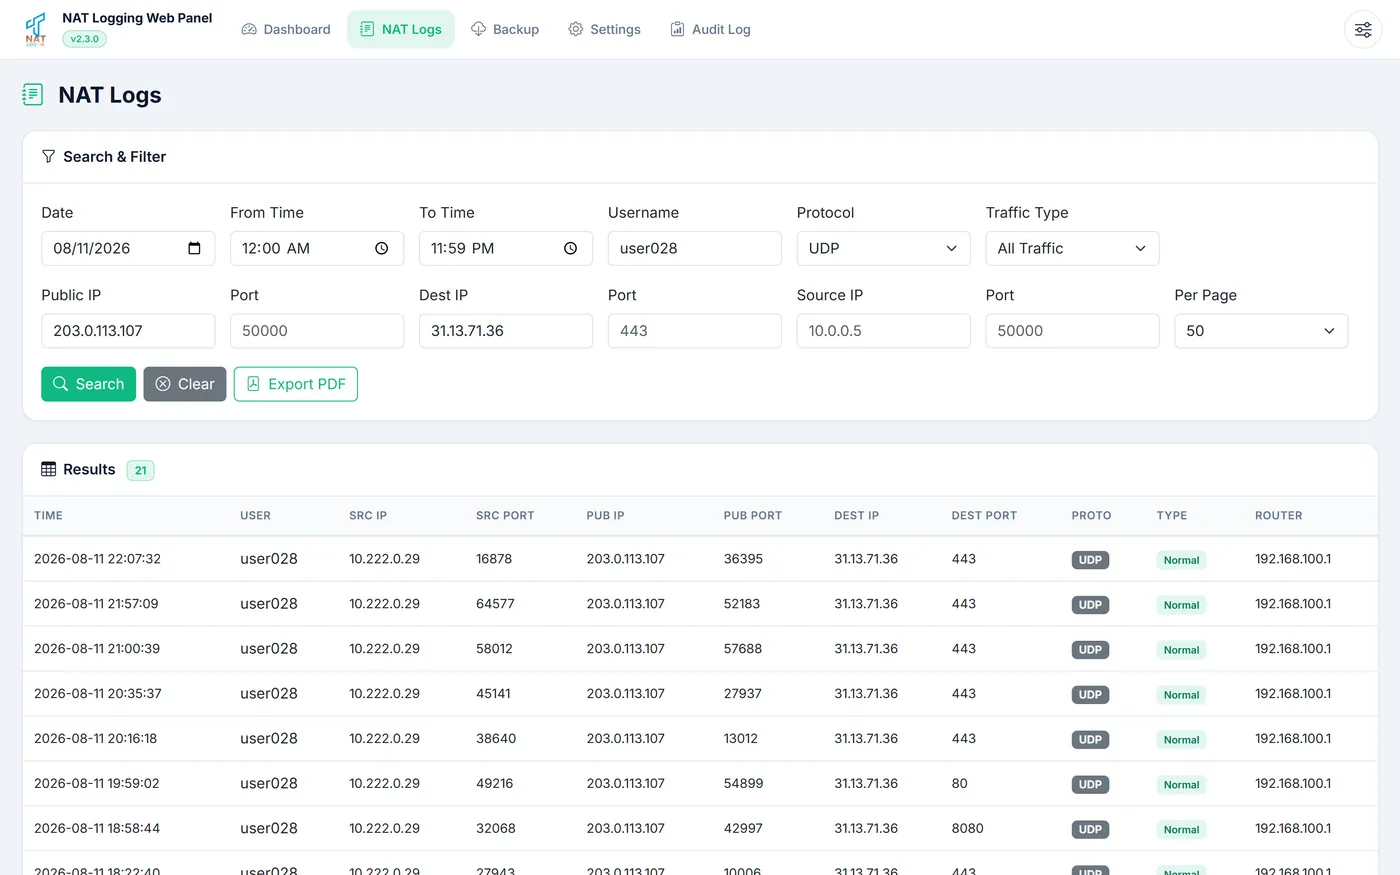
02 NAT Logs

Trace a session back to a subscriber

  • Public address, port and time in, subscriber out
  • Narrow by protocol, destination or private address
  • Addresses matched whole, never partially
  • Any window inside the day, down to the minute
The NAT Logs screen with filters and matching rows
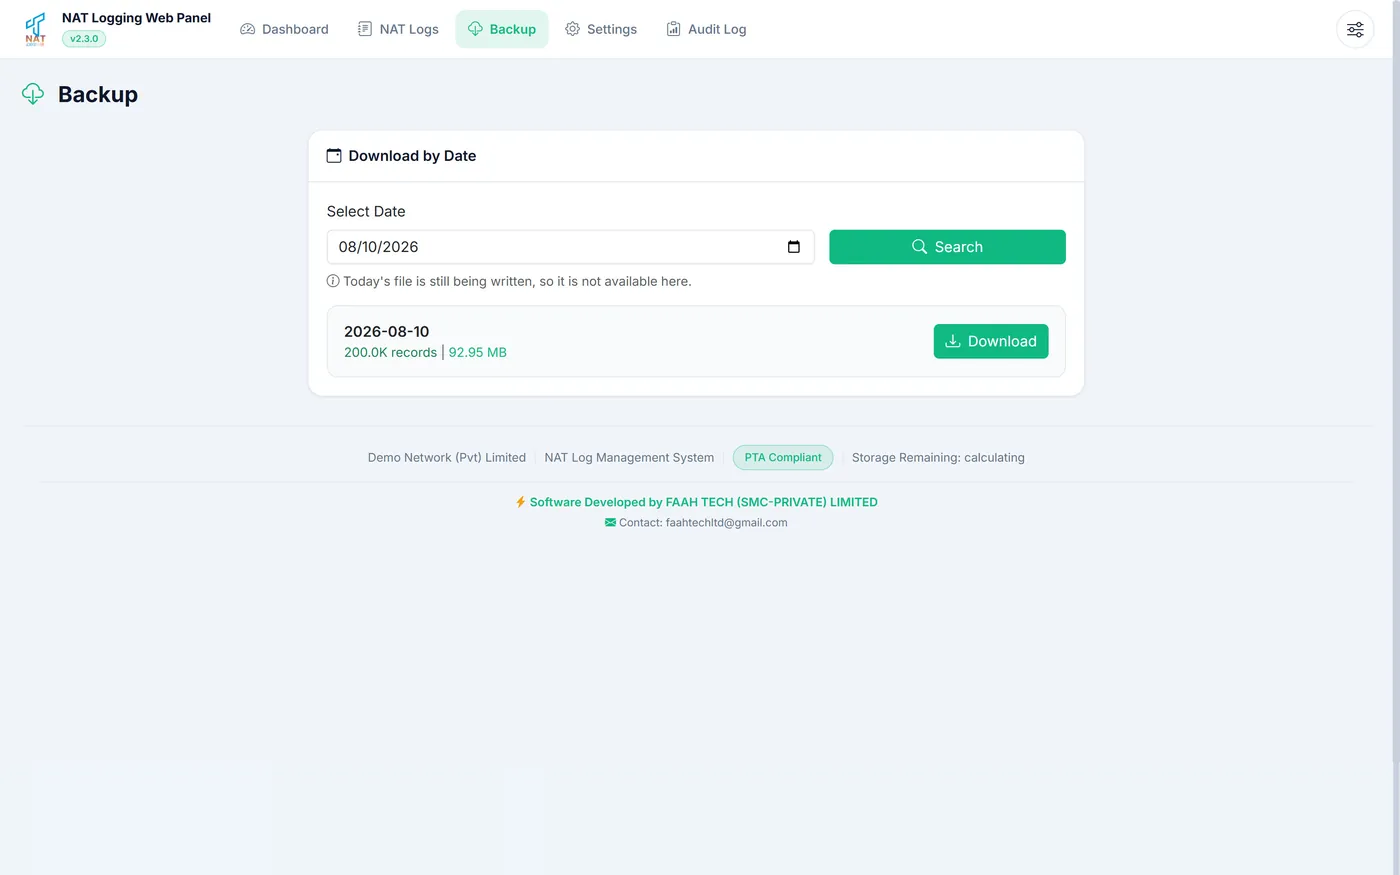
03 Backup

Take out any stored day

  • Record count and file size shown before you commit
  • Comes down in the format the server already stores
  • The day in progress is held back until it closes
The Backup screen showing a stored day ready to download
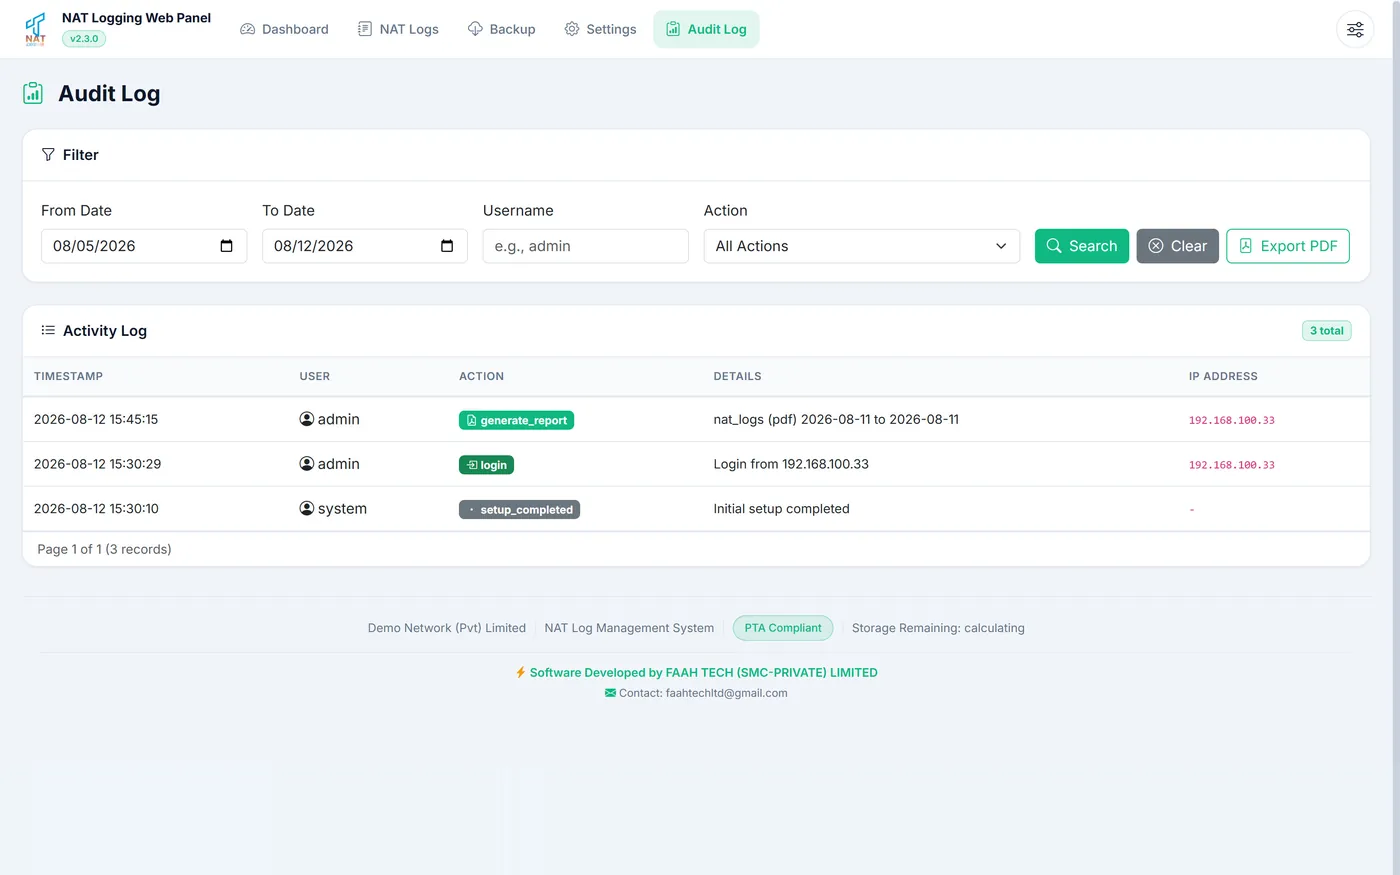
04 Audit Log

A record of panel activity

  • Operator, source address and timestamp on every entry
  • Logins and report generation both captured
  • Filter by date range, operator or action
The Audit Log screen listing administrative actions
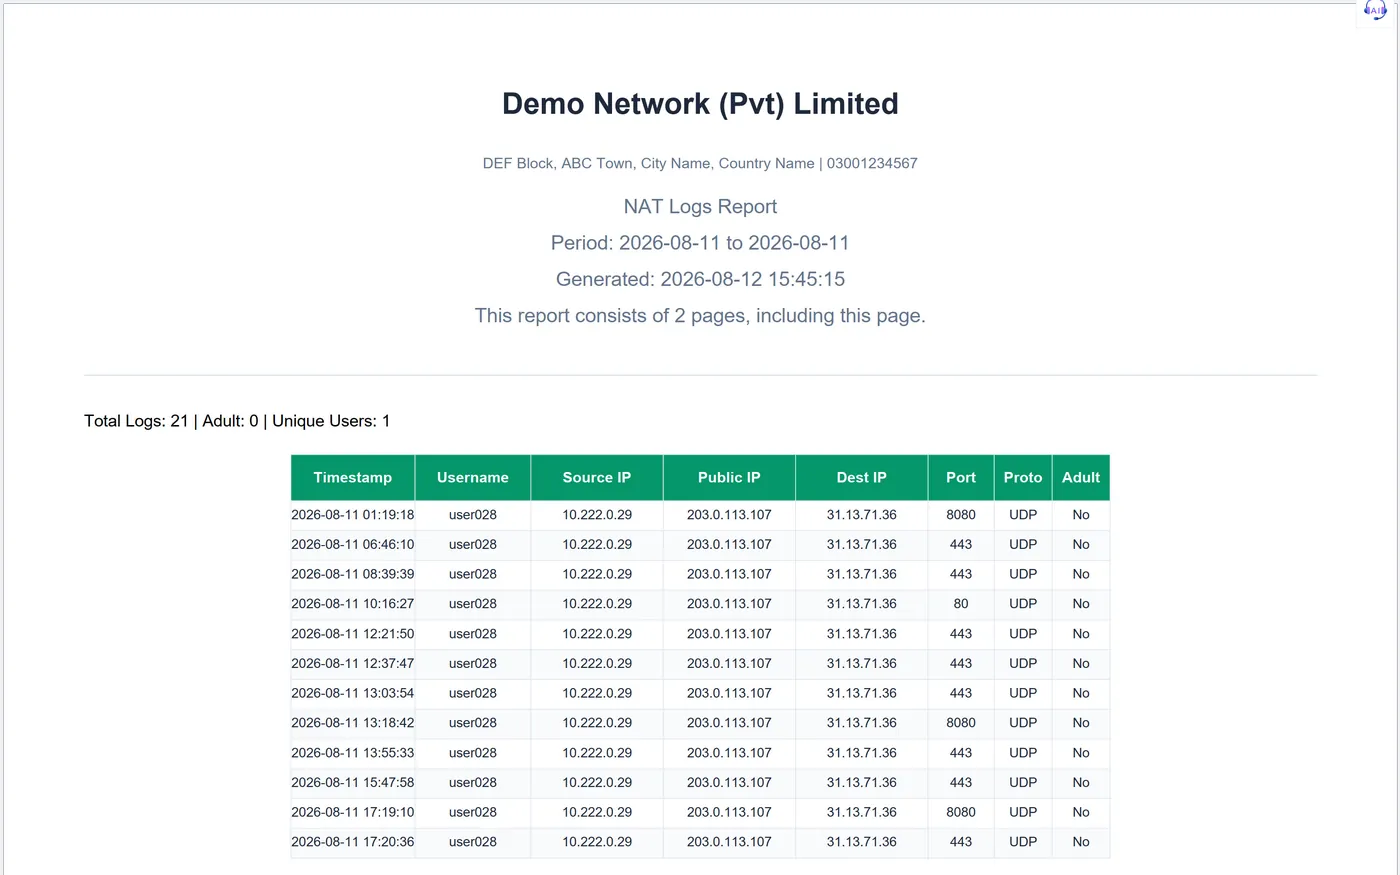
05 Report

The document that leaves your network

  • Operator name, address and period stated on the cover
  • One row per translated session, in sequence
  • Page count declared, so a missing page is obvious
  • Answers a PTA record request without further work
A generated PDF report with the operator name and the session rows

Seen enough?

Tell us how your network is set up and we will tell you what running this would take on your side.

Request a quote